
Know Your Business Is Slipping In Week One, Not at Year-End
Most problems in a business start small: margin drifts down, collections stretch out, a good customer goes quiet. AI health monitoring watches those vital signs every day and tells you the moment one of them moves outside its normal range.
50+ ERP and software projects. Zero failed projects since 2021.
Nobody plans to find out in March that October went wrong
Business problems rarely arrive as a single event. They build quietly across months, in numbers nobody was watching closely enough.
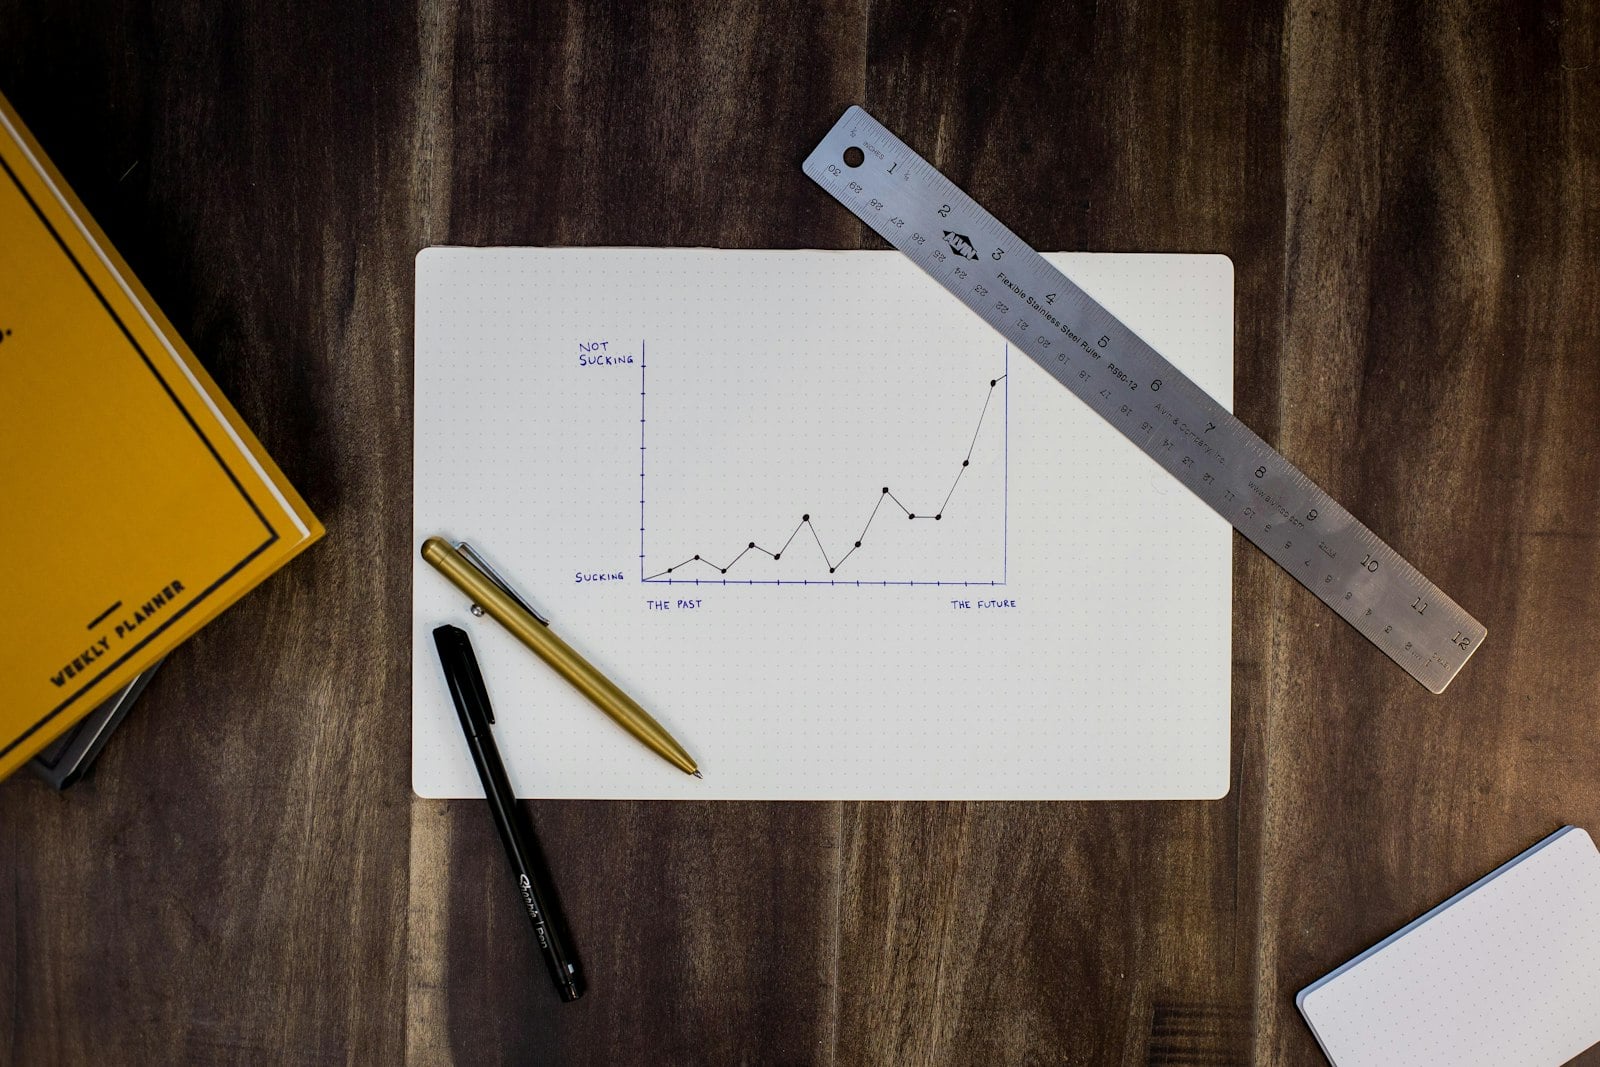
A two-point margin drop is cheap to fix in month one
Left alone for two quarters, the same drift quietly costs a year of profit. Monitoring compares every measure against your own history, so a slow movement is visible while it is still small enough to correct.
- Trends caught while they are still small.
- Comparison against your own normal, not an industry average.
- The drivers behind the movement, not just the total.
The check runs even in your busiest week
Manual reviews slip the moment the business gets busy, which is exactly when things start moving. Monitoring runs on its own schedule, so the health check happens whether anyone opens a report or not.
- Runs daily without anyone remembering.
- Warnings pushed to the person who owns the area.
- A short summary instead of a stack of reports.

The measures we watch, and what each one is telling you
Every measure is scored against your own history and your targets. Healthy means it is in its normal range, Watch means it is drifting, and Act means it needs a decision now.
Illustrative figures
From your live data to a warning you can act on
Six areas that tell you how the business is really doing
Each area carries its own measures, thresholds and owner, so a warning always lands with someone who can do something about it.
Revenue and demand
Order intake, enquiry flow, win rate and revenue against plan, month by month and by segment.
Cash and collections
Cash cover, collection days, overdue ageing, and customers whose payment pattern has changed.
Profitability
Gross and net margin by product, customer and order, and the cost movements behind a drop.
Working capital
Stock cover, slow-moving value, turns, and how much cash is tied up in inventory today.
Delivery and quality
On-time delivery, order delays, rejection rate, and the orders currently at risk of slipping.
Customer retention
Buying frequency by account, so a customer going quiet shows up before you lose them.
What monitoring changes for a leadership team
Why teams choose TCB Infotech for health monitoring
Business health monitoring questions
What is AI business health monitoring?
How is this different from a dashboard?
What does the health score actually measure?
Will it create alert noise?
Does it work with our existing systems?
Who should receive the warnings?
Get a Daily Health Check on Your Business
Book a free consultation. Tell us which measures worry you most, and we will show you how health monitoring would track them and when it would raise a flag.
Book a Free Consultation →No commitment. A practical look at the vital signs in your own data.
What Is Inside Business Health Monitoring
Monitoring only works if it watches the right measures, knows what normal looks like, and reaches the right person. Here is how each of those three parts is built for your business.
From agreed measures to a warning someone acts on
We monitor what matters in your business, not a generic list
We start by agreeing the measures that actually describe health for you, how each one is calculated, and what a good number looks like. A contract manufacturer and a distributor do not watch the same things, and the monitoring reflects that.
- Measures defined with your finance and operations heads.
- Targets set from your plan, not from a benchmark.
- Each measure has a named owner.
The system learns what normal looks like for you
The AI studies your history so a seasonal dip is understood as seasonal and a real drift is not lost inside it. Thresholds are tuned per measure, which keeps the alerts rare enough that people still read them.
- Normal ranges learned from your own data.
- Seasonality handled instead of flagged.
- Thresholds you can adjust as the business changes.
Every alert says what moved, by how much, and where to look
A warning is only useful if it points somewhere. Each one carries the measure, the size of the movement, the period it happened over, and the accounts, products or orders that drove it, so the owner can act the same day.
- The drivers behind the movement, not just the total.
- Delivered to the person who owns the area.
- Full drill-down to the underlying records.
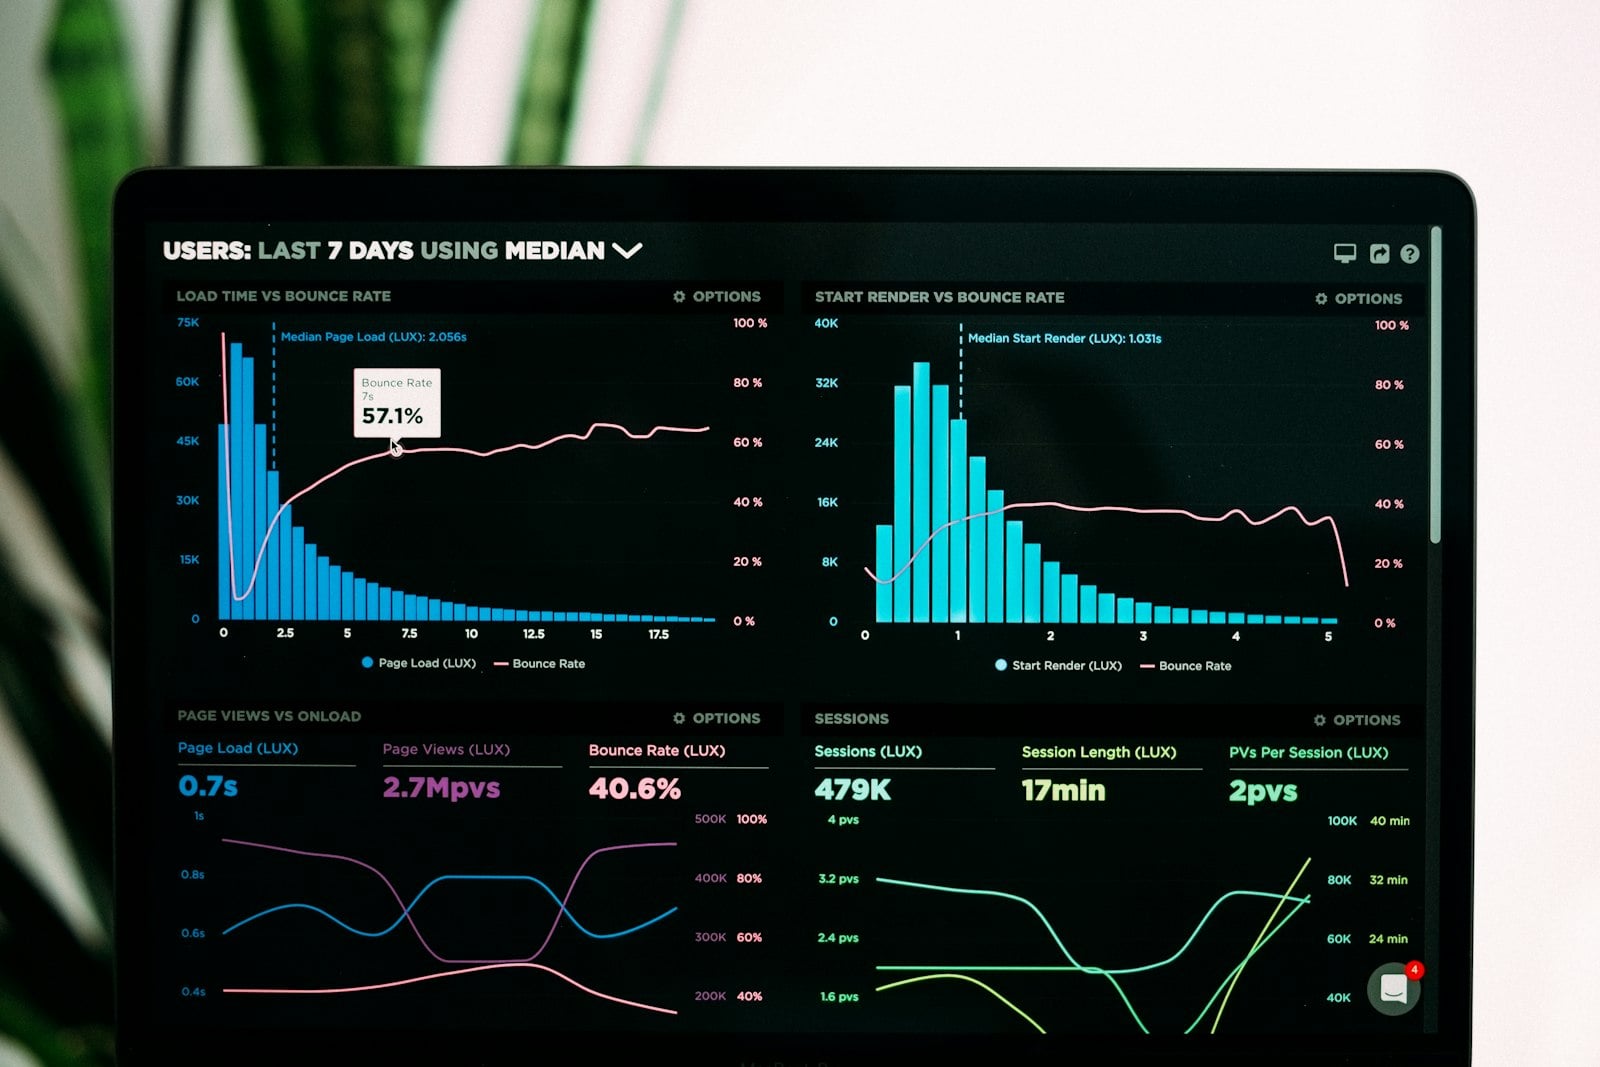
Everything the monitoring delivers
Overall health score
One number the leadership team can track, built from the areas you agreed matter most.
Early warnings
Alerts raised when a measure leaves its normal range, routed to the owner of that area.
Daily summary
A short morning digest of what moved, delivered by email or your messaging channel.
Cause analysis
The accounts, products or orders driving a movement, so the search starts in the right place.
Trend history
Every measure tracked over time, so you can see whether an action actually worked.
Tunable thresholds
Ranges and recipients you can change as targets, seasons and priorities move.