

Turn Finance Data into Live Answers
Reports build themselves from your ERP data instead of a month-end scramble. Dashboards show cash, receivables and margin in real time, and the team can ask a question and get the number straight away.
50+ ERP and software projects. Zero failed projects since 2021.
Reports should not take a week to build
When numbers are pulled and pasted by hand, they arrive late and rarely agree. Live reporting fixes both.
No more month-end assembly by hand
Reports are built from your live ERP data on a schedule, so they are ready when you need them and everyone works from the same numbers, not five versions in five spreadsheets.
- Built from live data, not exports.
- Ready on schedule, not after a scramble.
- One version of the numbers.
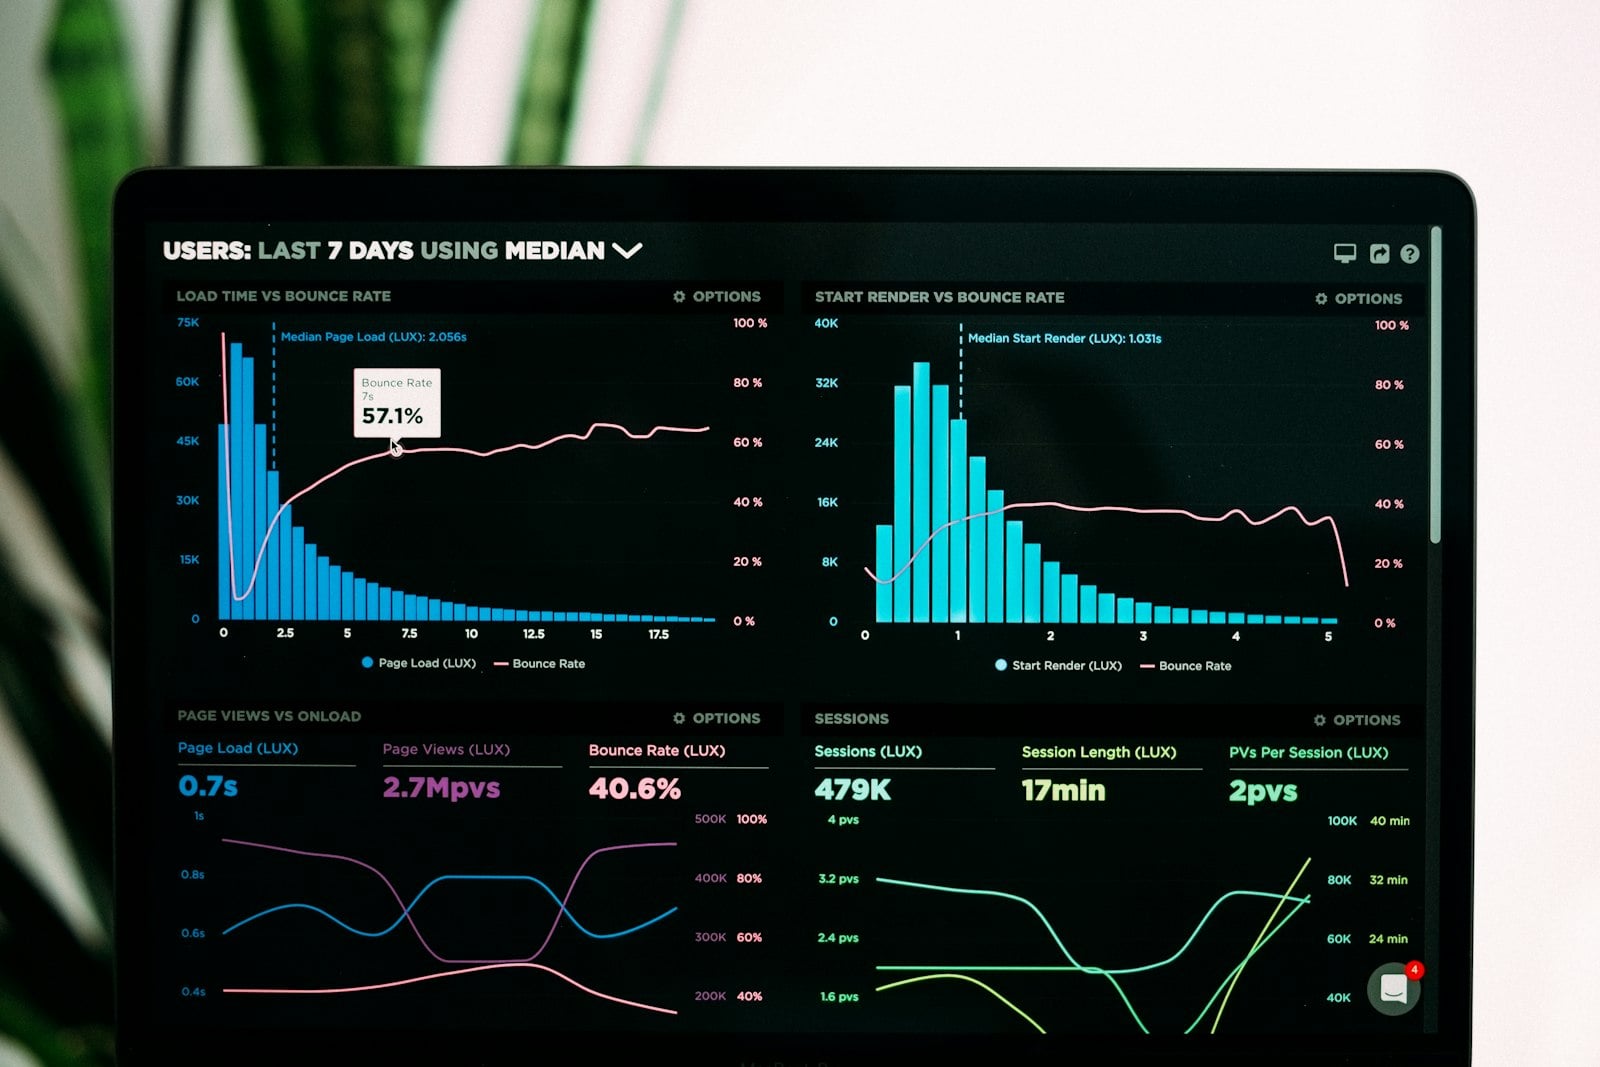
Get the number without waiting for a report
Someone can ask a question in plain words, such as which customers are overdue or how margin moved this month, and get the answer straight away, instead of raising a request and waiting.
- Questions asked in plain language.
- Answers from your own live data.
- No queue for a report to be pulled.
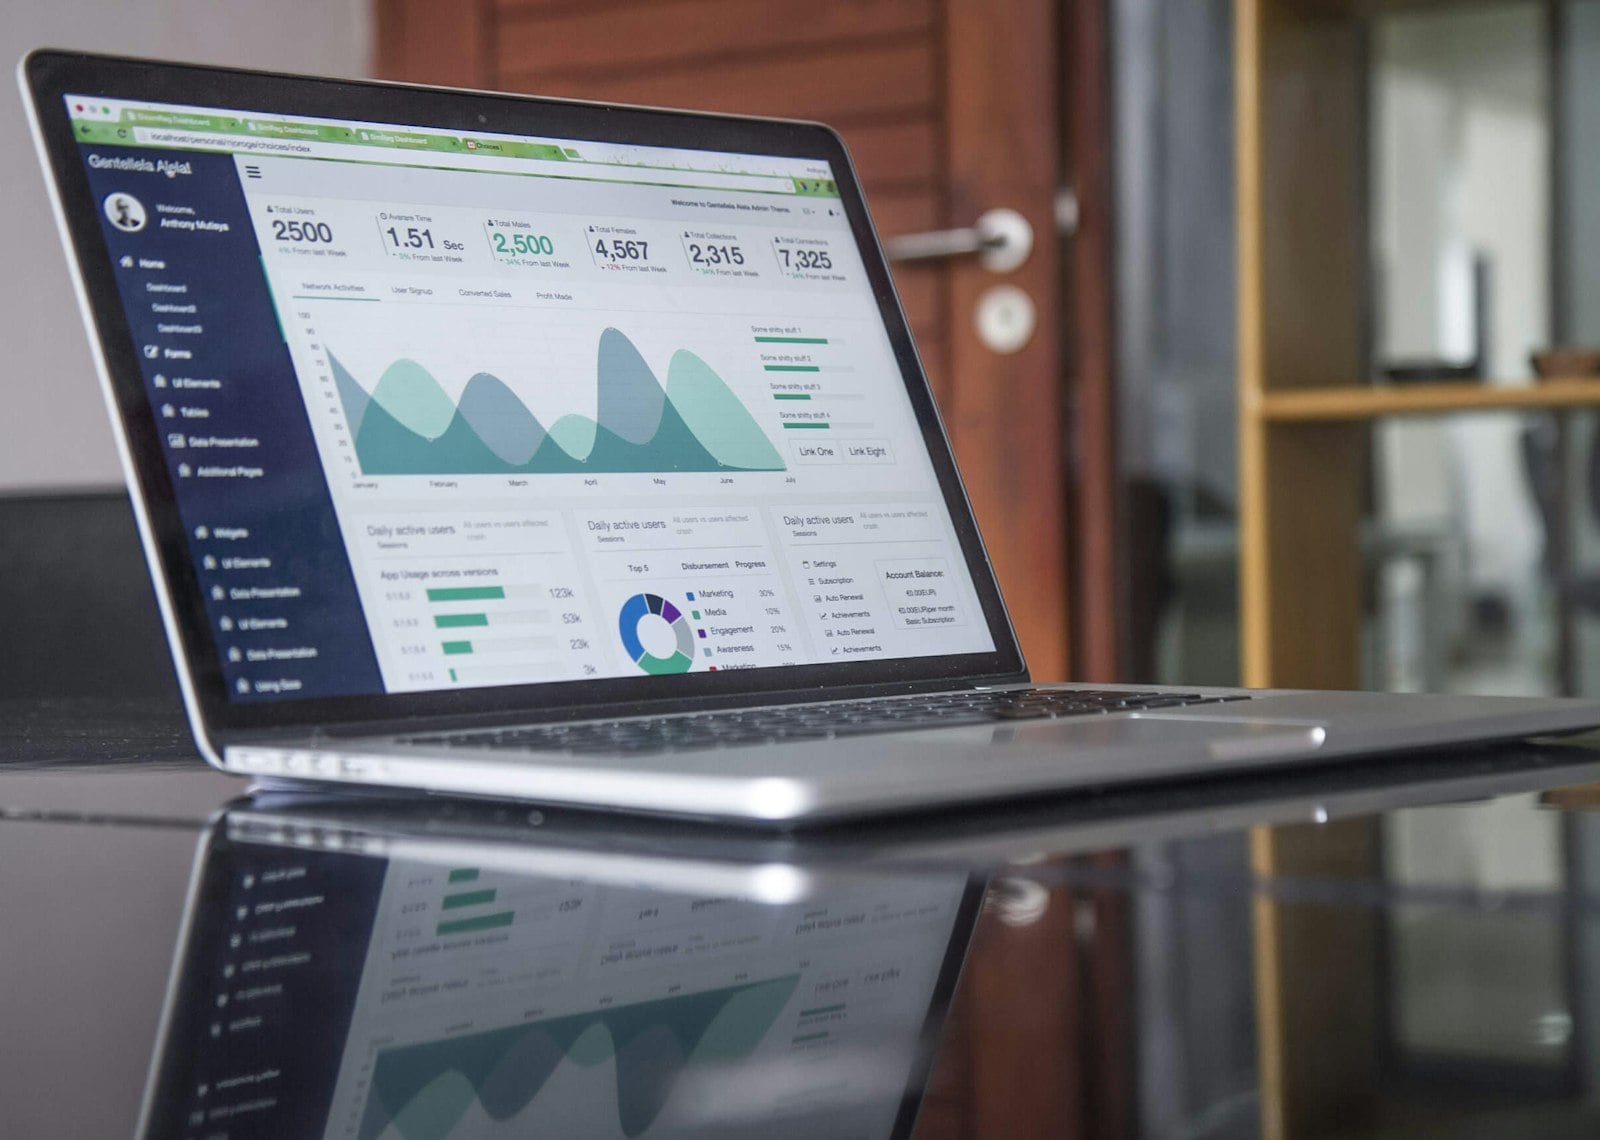
The numbers that run the business, in one place
Cash and liquidity
Cash position, inflows and outflows, and a live view of what is coming.
Receivables and payables
Who owes what, who you owe, and where money is stuck.
Profit and margin
Margin by product, customer or unit, so thin margins show early.
Revenue and sales
Revenue trends, by region, product or team, against target.
Spend and cost
Where the money goes, with cost trends and outliers flagged.
Statutory reports
The recurring reports you need, built from the same live data.
How we set up your reporting
What live reporting changes
Why teams choose TCB Infotech for reporting
Financial reporting and analytics questions
What is AI financial reporting and analytics?
Does it replace our finance team?
Where does the data come from?
Can we ask questions in plain language?
Are the numbers reliable?
How long does it take to set up?
See Your Finances in Real Time
Book a free consultation. We will look at your data and show you the live reports and dashboards you could have running.
Book a Free Consultation →No commitment. A practical first look at your reporting.
What Is Inside AI Financial Reporting
The output is live reporting you can trust, not another spreadsheet to maintain. Here is what we connect, how we build it, and what you walk away with.
From live data to answers on demand
Reports that build themselves from your data
We connect your ERP and finance systems and build the reports and dashboards on that live data, so they are current and ready when you need them, with no manual assembly.
- Reports built from live ERP data.
- Dashboards for cash, receivables and margin.
- Ready on schedule, not after a scramble.
Ask a question, get the number
The team can ask in plain words and get the answer from live data, so people are not waiting in a queue for someone to pull a report every time they need a figure.
- Questions asked in plain language.
- Answers straight from your data.
- No report request queue.
Figures you can stand behind
We define the calculations with your team and build them on your live data, so every number is consistent and can be traced back to the source, not guessed at.
- Calculation logic agreed with finance.
- One consistent version of the numbers.
- Traceable back to the source data.

Everything the reporting delivers
Cash and liquidity
Cash position, inflows and outflows, and what is coming.
Receivables and payables
Who owes what, who you owe, and where money is stuck.
Profit and margin
Margin by product, customer or unit, with thin margins flagged.
Revenue and sales
Revenue trends against target, by region, product or team.
Spend and cost
Where the money goes, with trends and outliers flagged.
Recurring reports
The reports you need each period, from the same live data.