
Run Your Whole Business From One Live Screen
Most owners still piece the picture together from four reports, two spreadsheets and a phone call. An AI CEO dashboard pulls sales, cash, stock, margin and production into one place, keeps it current, and tells you what needs a decision today.
50+ ERP and software projects. Zero failed projects since 2021.
You should not have to ask four people how the business is doing
When the numbers live in different systems and arrive late, decisions get made on memory and gut feel. A live executive dashboard puts the same facts in front of everyone.
Stop reconciling four reports before a review meeting
Sales quotes one number, finance quotes another, and the plant has a third. The dashboard reads all of them from the source systems, so the review starts with agreed figures instead of an argument about whose sheet is right.
- Sales, finance, stock and production in one view.
- Every figure traceable back to its source record.
- The same numbers for you and your managers.

Find the problem in week one, not after closing
A margin drop, a customer who stopped ordering, or a job running over cost is cheap to fix early and expensive to fix in hindsight. The dashboard watches those movements as they happen and puts them in front of you while there is still time to act.
- Movements flagged the week they happen.
- The reason behind the change, not just the number.
- Fewer surprises at month-end close.
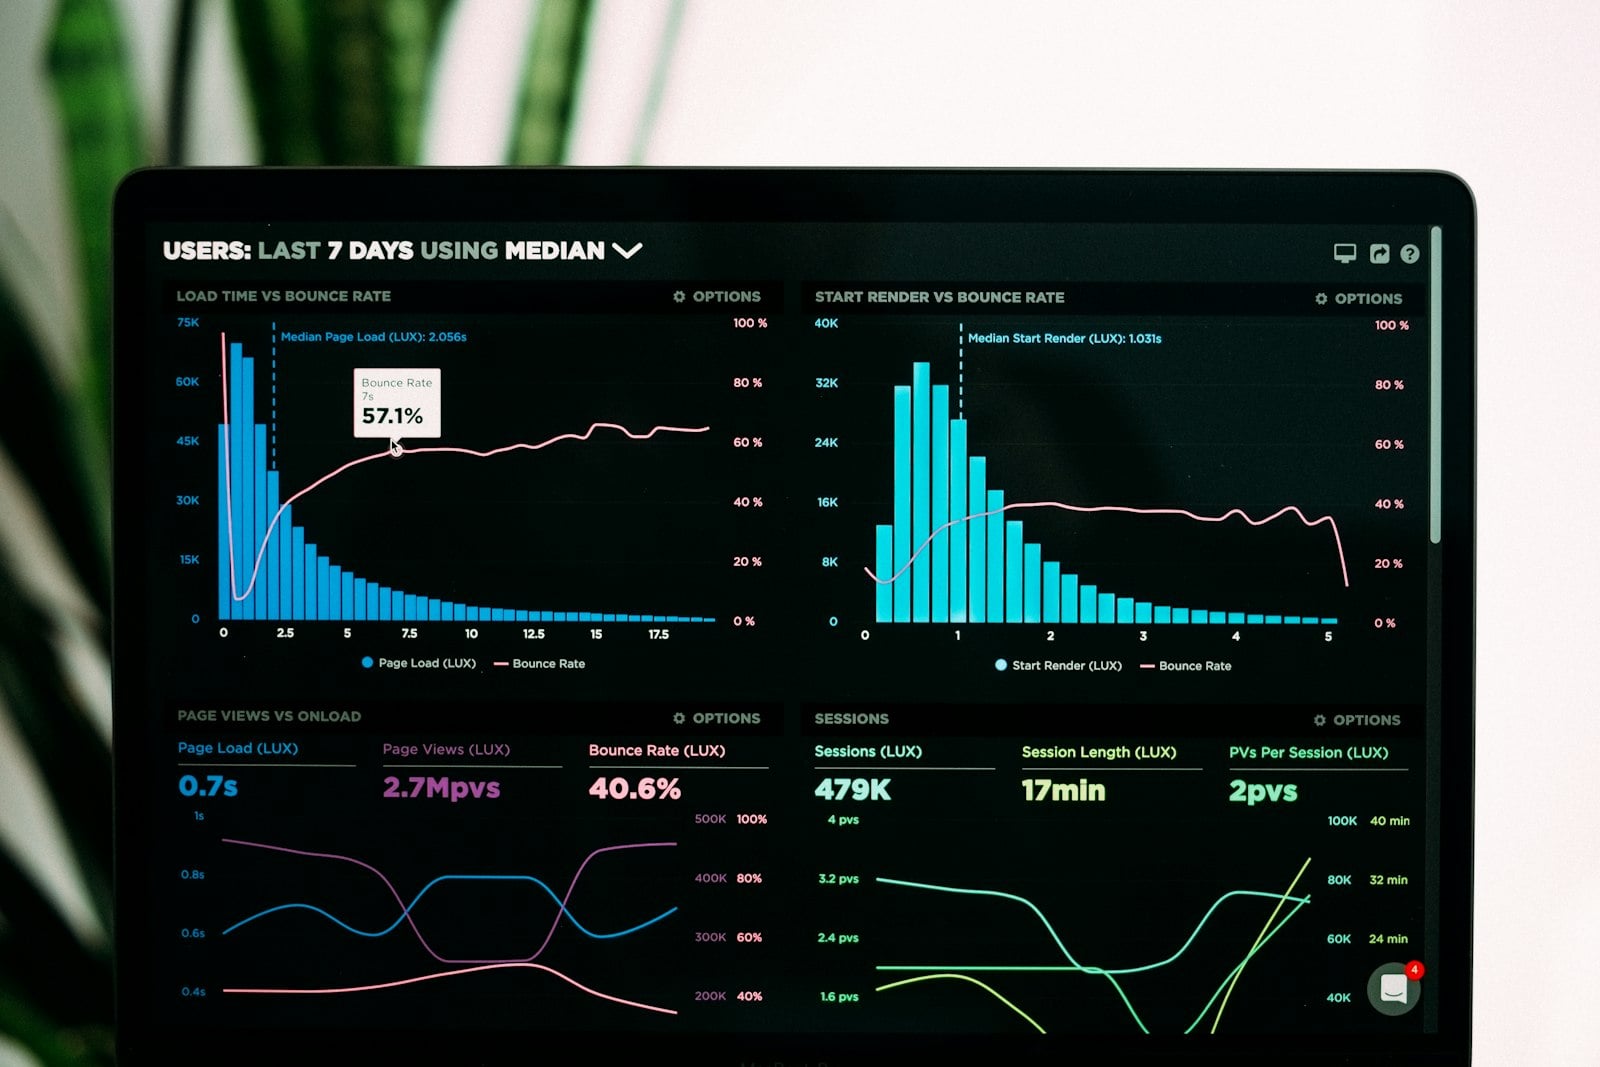
The numbers you actually run on, in one place
We build the dashboard around the handful of figures you already check every day, then add depth once you trust them. Every tile opens into the detail behind it.
From scattered systems to one screen you check every morning
Six views most owners ask for first
Each one is built from your live data, and each one drills down to the invoices, orders or entries behind the total.
Sales and order book
Revenue by month, customer, product and region, with the confirmed order book sitting behind it.
Cash and receivables
Cash in hand, expected inflow, ageing of what customers owe you, and who is slipping.
Margin and cost
Gross and net margin by product, customer and order, so you see where profit is really made.
Stock and working capital
Stock value, cover in days, slow-moving items, and the money sitting still on your shelves.
Production and delivery
Plan against actual output, delays, rejections, and orders at risk of missing their date.
People and cost centres
Headcount, attendance, cost per department, and how each cost centre tracks against budget.
What changes once the dashboard is running
Why owners choose TCB Infotech for executive dashboards
AI CEO dashboard questions
What is an AI CEO dashboard?
How is this different from the reports my ERP already gives me?
Which systems can it pull data from?
Can I ask it questions in plain language?
Who can see which numbers?
How long does it take to set up?
See Your Business on One Screen
Book a free consultation. Tell us the numbers you check every morning and the systems they sit in, and we will show you what your CEO dashboard would look like.
Book a Free Consultation →No commitment. A practical look at what your data can already show you.
What Is Inside an AI CEO Dashboard
The dashboard is built on your live systems, not on a monthly export. Here is what it connects to, what it shows each person, and how the AI layer turns movements into something you can act on.
From connected systems to a decision you can make today
One view built from every system you run
We connect your ERP, accounting software, CRM, production system and the spreadsheets that are still part of the process, then match customers, items and cost heads so a figure means the same thing wherever it came from.
- Direct connections to your live systems.
- Customer, item and cost data reconciled once.
- Every total drills back to its source record.
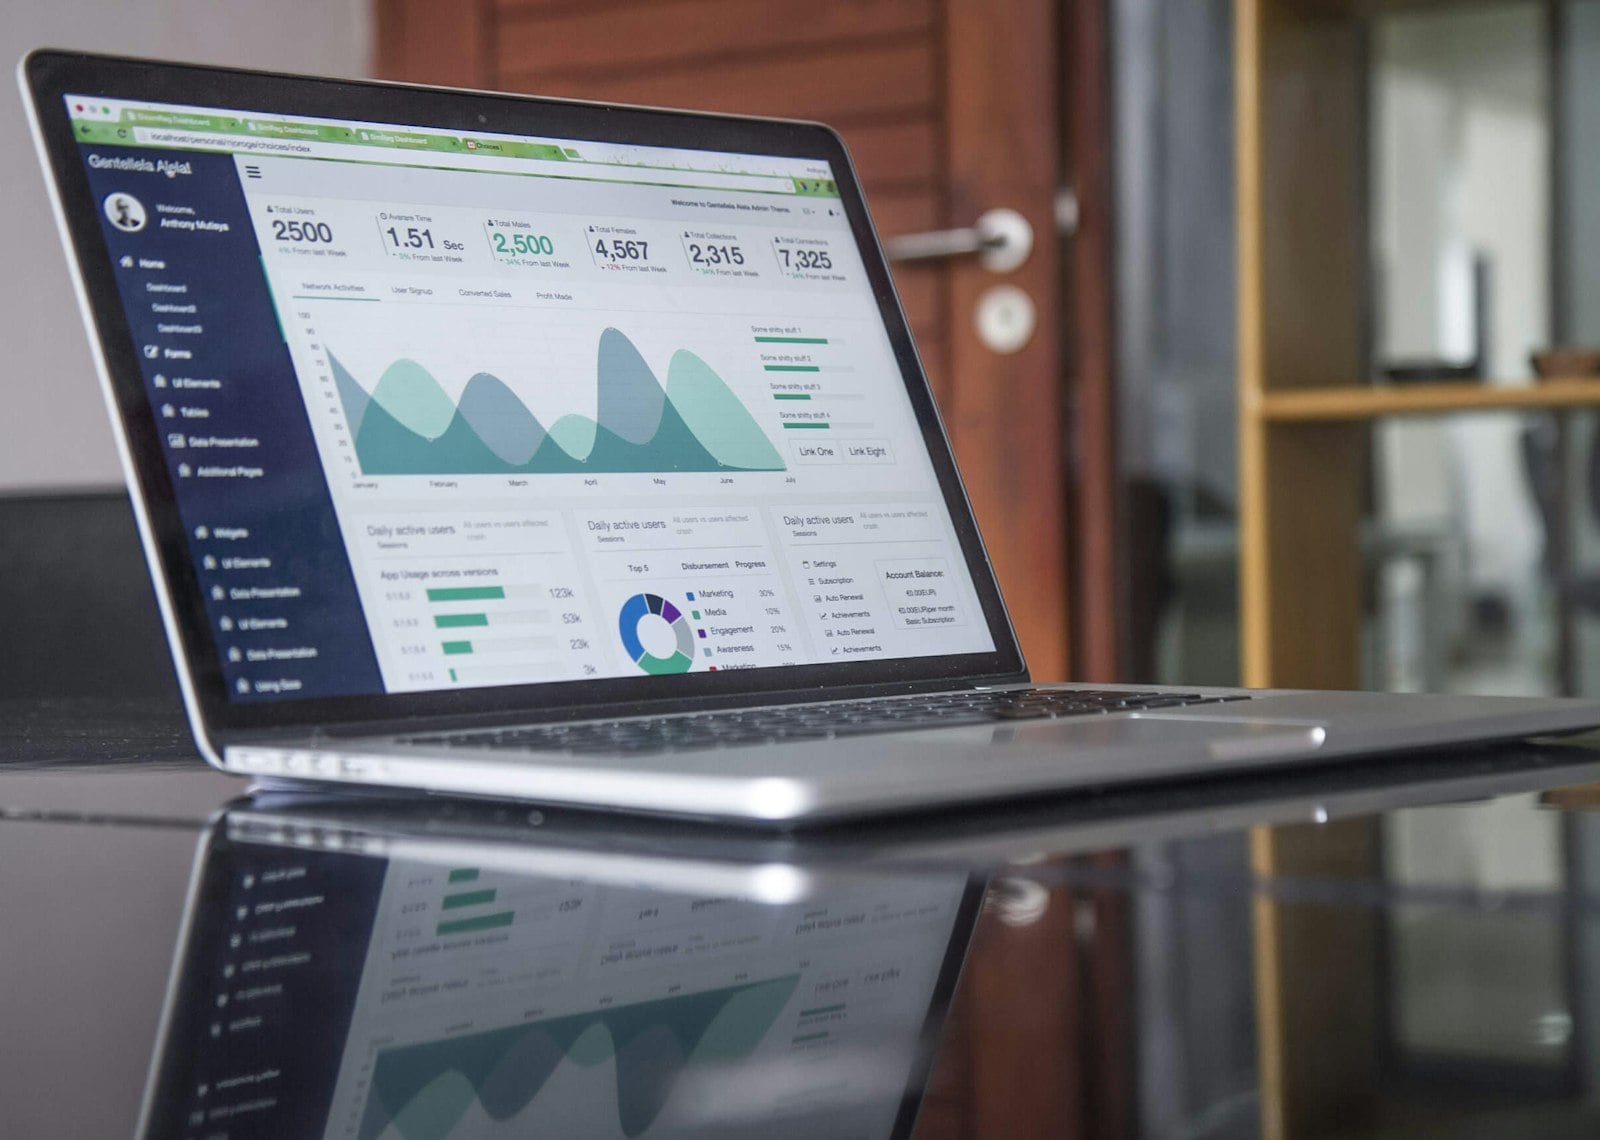
Each person sees the numbers that belong to them
The owner sees the full picture across sales, cash, margin and plant. A sales head sees pipeline, orders and collections for their region. Sensitive figures such as cash position, salary cost or customer-level margin stay with the people who should see them.
- Separate views for owner, finance, sales and operations.
- Access controlled figure by figure.
- The same underlying data behind every view.
It tells you what changed, and answers what you ask
The AI watches your numbers for movements that matter, explains the likely reason with the supporting figures, and answers typed questions such as which customers slowed down this quarter. You decide what to do with the answer, and you can always see the records behind it.
- Exceptions brought to you instead of buried in a report.
- Plain-language answers with the source numbers attached.
- Model-agnostic, matched to your data and your rules.
Everything the dashboard delivers
Live KPI tiles
Sales, cash, order book, margin, stock and output on one screen, current to the last entry.
Exception alerts
Movements that need a decision are pushed to you, with the numbers that triggered them.
Drill-down to source
Open any total and see the invoices, orders or entries it was built from.
Ask in plain language
Type a business question and get an answer backed by the underlying figures.
Mobile and daily digest
The same view on your phone, plus a short morning summary of what moved.
Role-based access
Each person sees their own area, and confidential figures stay restricted.