
Predict Demand for Every Product and Stop Guessing Your Stock
AI reads your sales history, seasonality and trends and predicts how much of each product you will sell, per location. You get an accurate number and a confidence level for each SKU, so planning, purchasing and production work from one figure.
50+ ERP and software projects. Zero failed projects since 2021.
Guessing demand costs you twice
Order too little and you run out and lose the sale. Order too much and cash sits on the shelf as dead stock. A good forecast fixes both.
Forecasts that match how your business really sells
The model learns from your past sales, your busy and slow seasons, and the direction each product is heading. It reflects your real demand, not a generic industry average, so the numbers make sense to the people who plan and buy.
- Trained on your sales history per product.
- Aware of your seasons and promotions.
- Tuned to your locations and channels.
Planning, purchasing and production agree on the demand
When sales, planning and the factory each work off a different guess, they order the wrong amounts and blame each other. A single forecast per product, with a confidence level, gives every team one figure to plan against.
- The same demand number across teams.
- A confidence level so you know what to trust.
- Fewer rush orders and last-minute changes.

Three signals behind every number
The model weighs these together for each product, then updates them as fresh sales come in.
From your sales data to a number you can plan on
Demand answers for the decisions you make weekly
One model, many views, all from the same clean history.
Demand per SKU
A predicted quantity for each product, so you order and make the right amount instead of a round guess.
Demand per location
Separate forecasts for each warehouse, store or region, so stock sits where it will actually sell.
Short and long horizon
Next-week numbers for replenishment and longer views for buying, budgeting and capacity planning.
Seasonal peaks
Predicted lifts for festivals, weather and promotions, so you prepare stock before the rush, not after.
Rising and falling items
A clear flag on which products are trending up and which are fading, so you invest and clear accordingly.
Confidence on each number
A confidence level per forecast, so planners know which items to trust and which to review by hand.
What a good forecast does for your stock
Why teams choose TCB Infotech for demand forecasting
Demand forecasting questions
What is AI demand forecasting?
Does it use our own data?
How accurate are the forecasts?
What is a confidence level and why does it matter?
Do we need to replace our ERP to use this?
How long does it take to see forecasts?
See What AI Would Forecast for Your Products
Book a free consultation. We will look at your sales history and systems, and show you what an AI demand forecast would look like for your top products and locations.
Book a Free Consultation →No commitment. A practical first look at your demand data.
What Is Inside AI Demand Forecasting
The forecast is a working number your planners and buyers use every week, not a one-off report. Here is what it predicts, how it shows confidence, and how it reaches the screens your team already works in.
From your sales history to a number you plan on
A predicted demand number for each product and place
Instead of one blanket target, you get a demand figure for every product at every warehouse, store or region. That is the level at which you actually order and hold stock, so the number is one you can act on directly.
- A quantity per SKU, not a category guess.
- Separate numbers per location and channel.
- Short-term and longer-horizon views.

Every number is backed by the signals behind it
The model weighs your past sales, your seasonal peaks and dips, and whether each item is rising or falling. As new sales arrive it updates, so the forecast keeps up with real demand instead of drifting away from it.
- Learns from your own sales history.
- Handles festivals, weather and promotions.
- Adapts as patterns shift over time.

A confidence level, fed into planning and purchasing
Each forecast shows how sure the model is, so planners trust the strong items and review the weak ones. The numbers flow back into the ERP and planning screens your team uses, so nobody has to re-key a spreadsheet.
- Confidence level on every SKU forecast.
- Low-confidence items flagged for review.
- Numbers delivered into your existing tools.
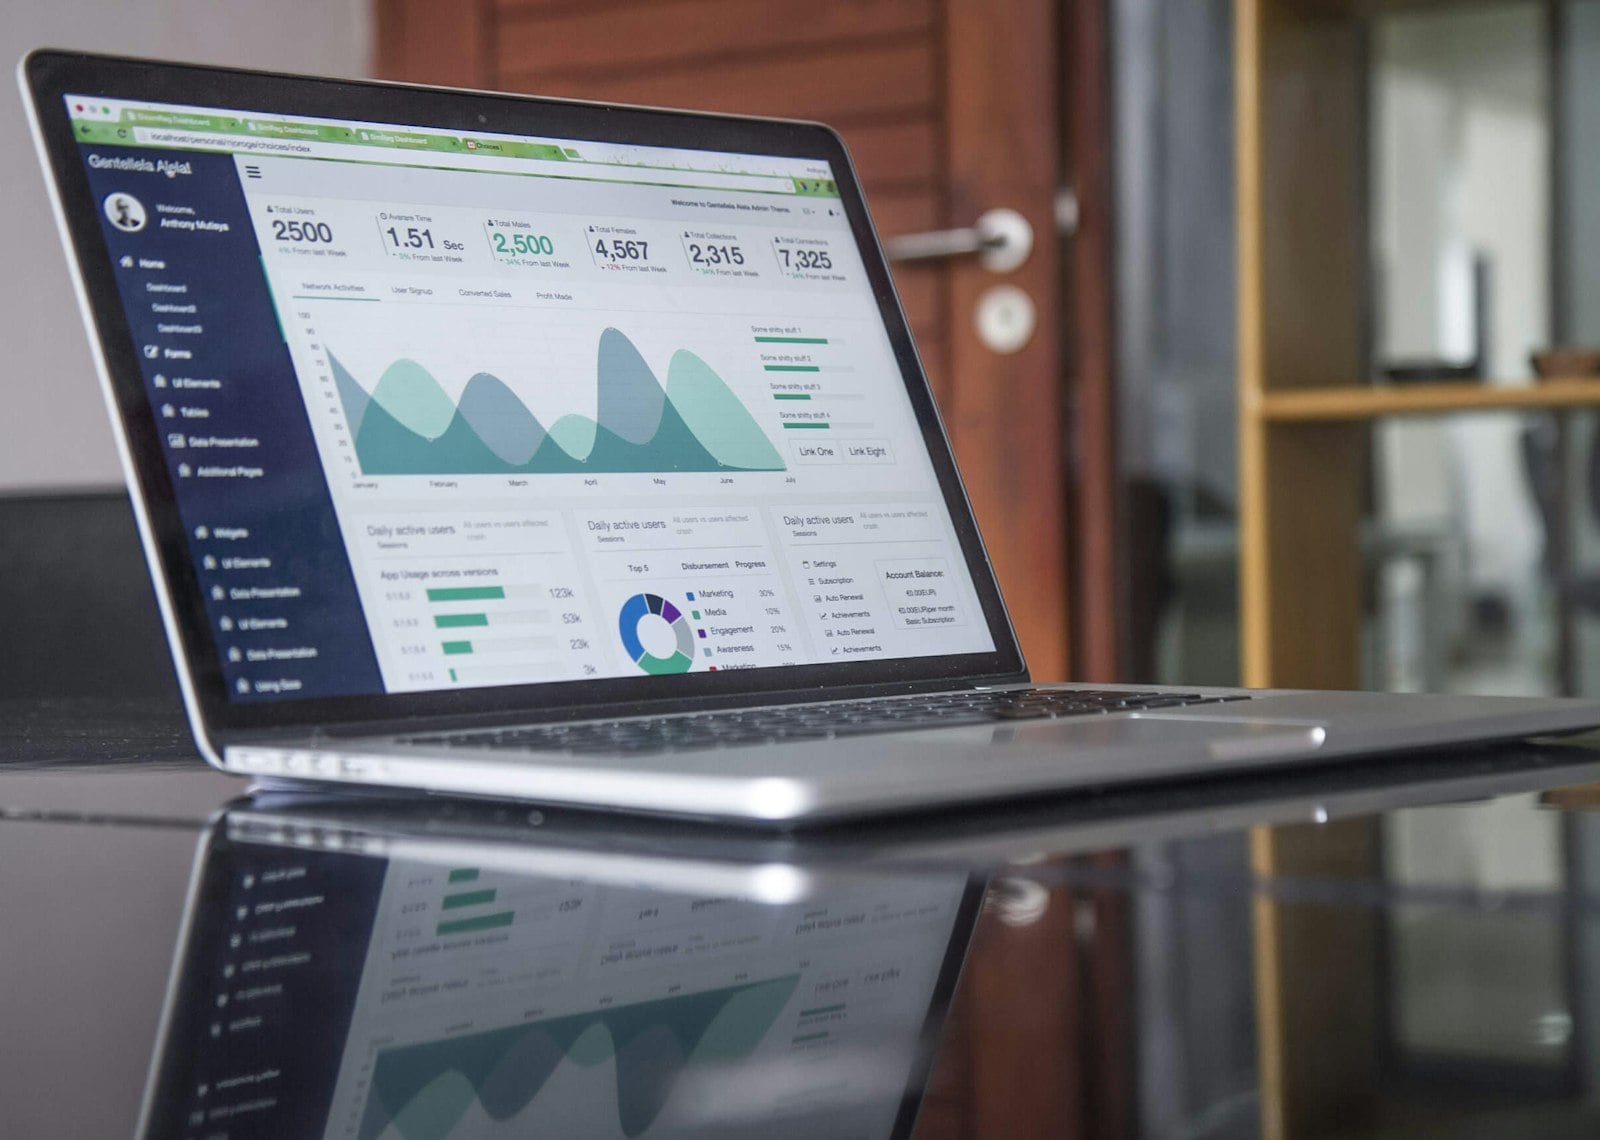
Everything the forecast delivers
Demand per SKU
A predicted quantity for each product, at the level you order and hold stock.
Per-location split
Separate forecasts for each warehouse, store or region, so stock sits where it sells.
Confidence level
A confidence score on every number, so planners know what to trust and what to review.
Seasonality and trend
Peaks, dips and direction built into each forecast, from your own history.
Adapts over time
The model refreshes as new sales arrive, so the number stays close to real demand.
Fed into your systems
Forecasts delivered into the ERP and planning screens your team already uses.